Monitoring tab in EDC/CDMS
Table of Contents
The 'Monitoring' tab gives an overview of all the queries, data validations and dropped verifications in a study.
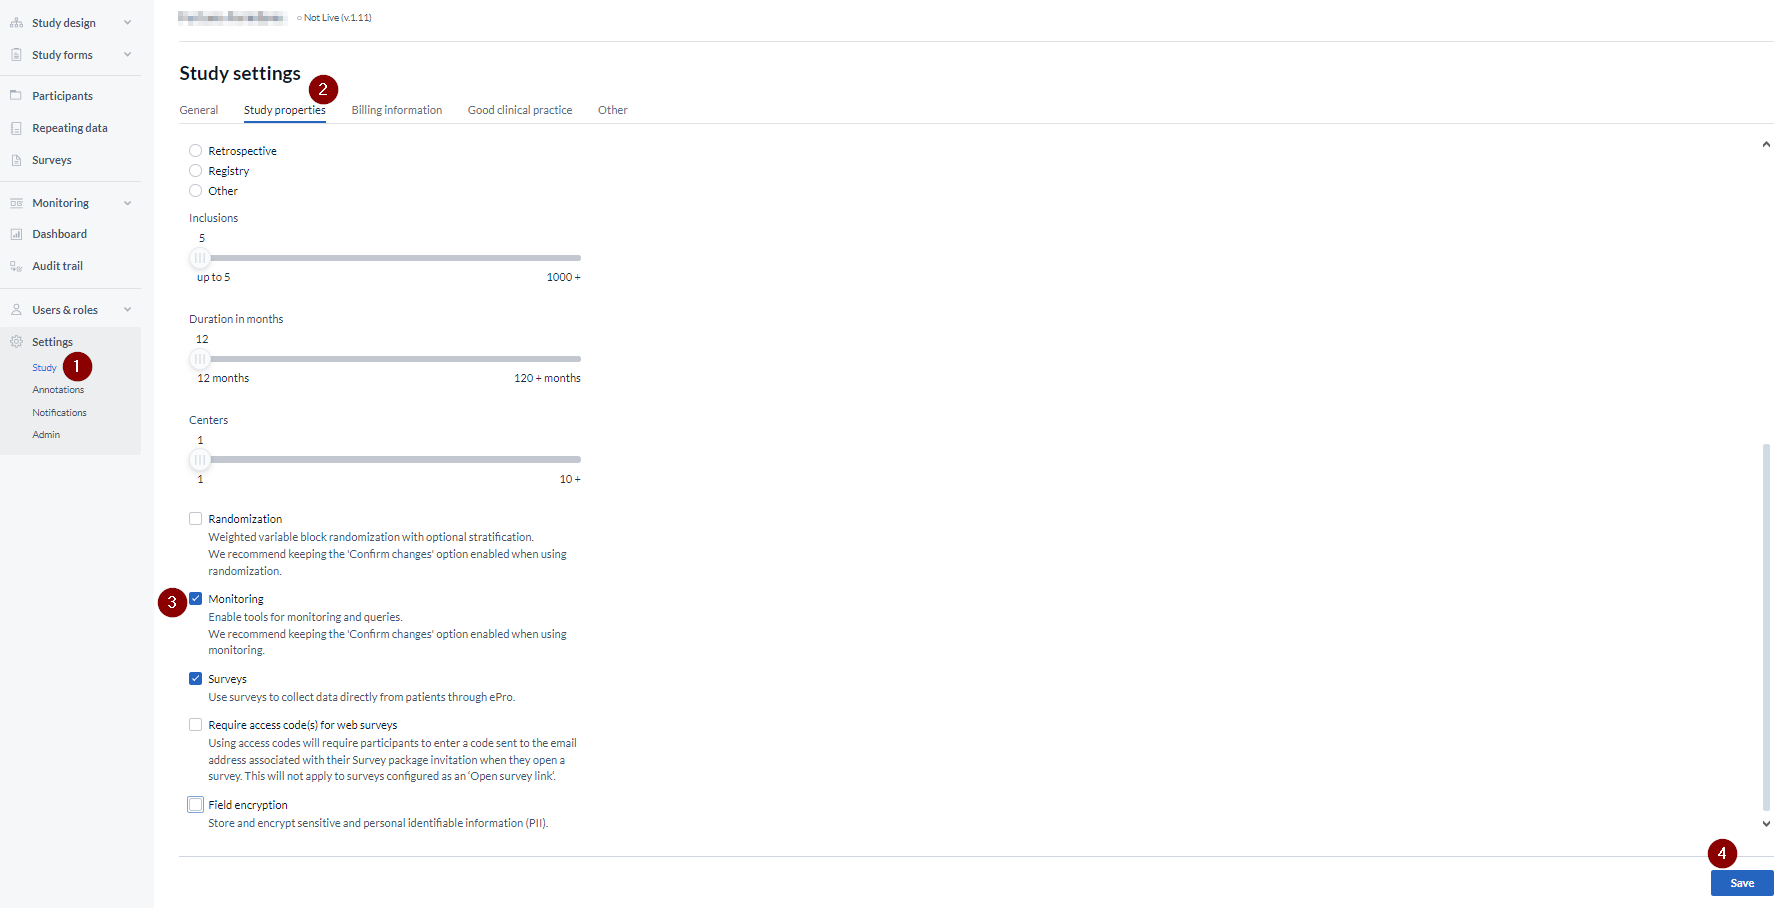
To enable monitoring for your study, follow these steps:
- Go to the study 'Settings'
- Navigate to the Study properties tab
- Check the box next to the 'Monitoring' option
- Save the change
Once enabled in the study, users with the ‘View’ permissions can view the participant and gobal 'Monitoring' tab, which contains overviews of queries, data validations and dropped verifications, as well as SDV Plans. The content of each listing is filtered according to the user’s View right for each site.
Source Data Verification (SDV) Plans
SDV plans within Castor EDC/CDMS are critical for maintaining data accuracy and integrity by enabling systematic verification of entered data against source documents. Users can define SDV plans specifying the fields or records that require verification. Once implemented, fields included in the SDV plan are clearly marked in the data entry view, and their status is tracked across the study. This allows for efficient monitoring and ensures adherence to study protocols
The 'Monitoring' tab contains several sub-tabs. When accessing each individual sub-tab 'Queries', 'Validations', ‘Verifications’ columns width and/or columns order settings are user-specific in that each user's choice of access is retained even after the user logs off and is maintained until the user changes it again.
Queries
Open the 'Queries' tab to access the queries overview. An overview of all queries in the study (unless you filtered the results) are displayed here.
- Using the 'Filters' button, you can filter the queries:

- It is possible to filter by status (open, resolved, closed or all Monitoring queries), or by Site to only show queries for participants which belong to a particular Site, or by creation date:
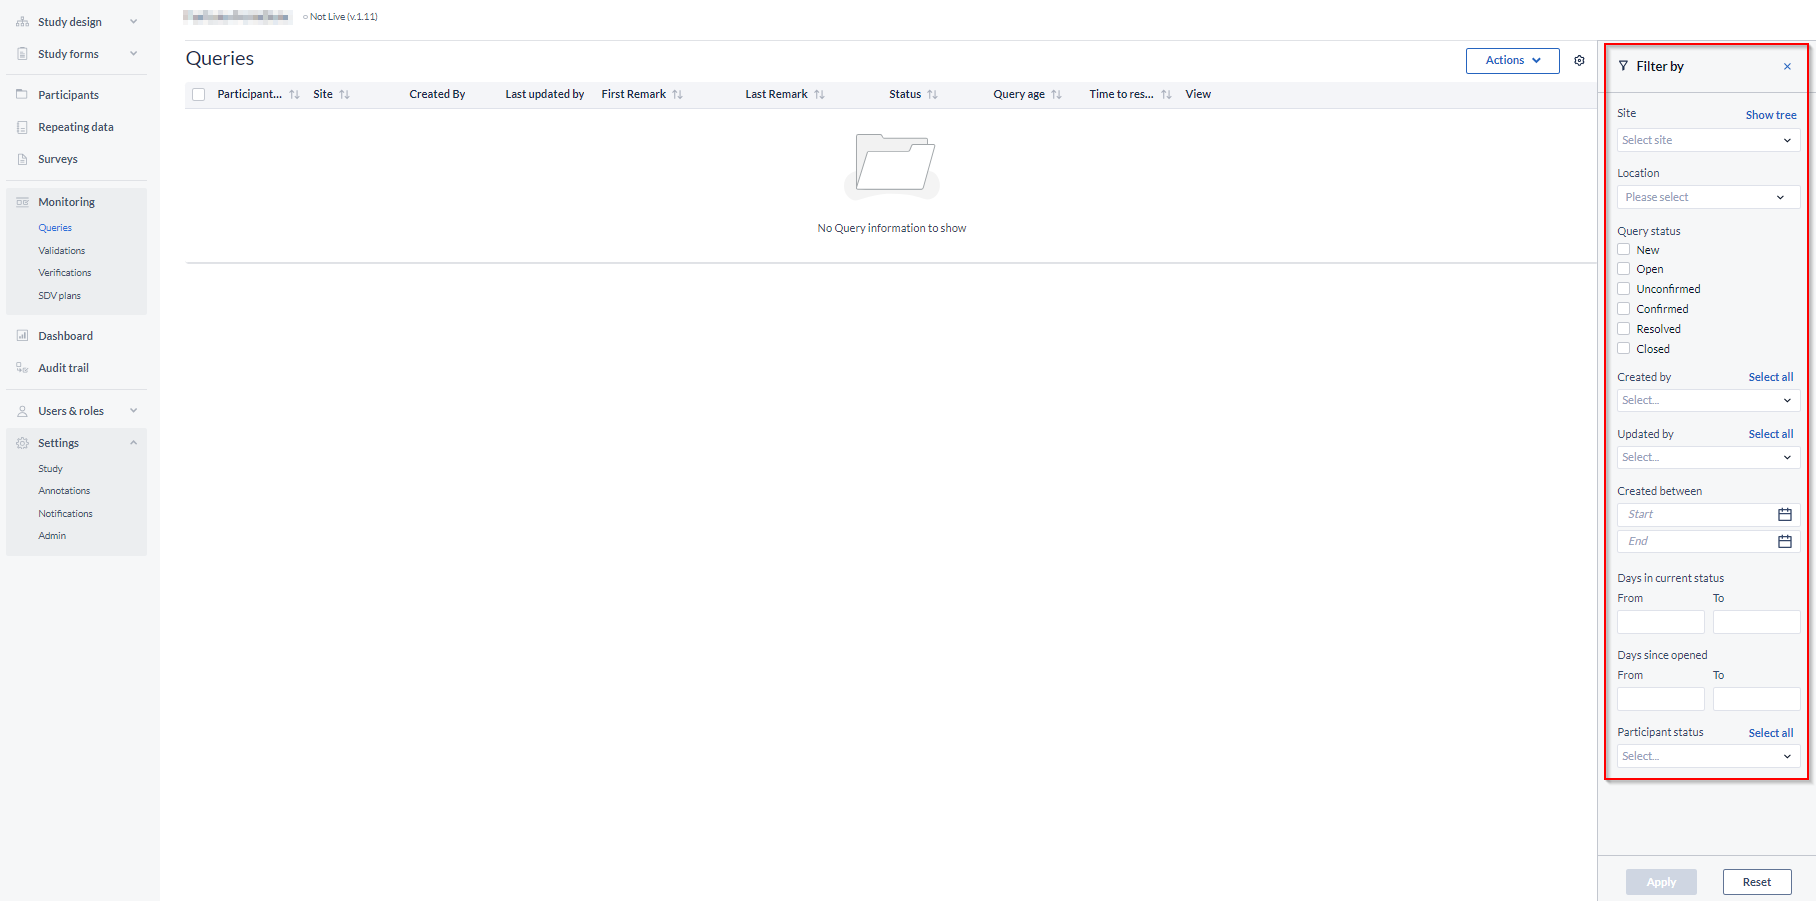
By clicking on the column name, the queries can be sorted based on the associated participant ID, Site, creation date, location (in the forms), first and last remark, status, query age, or by time to resolve.
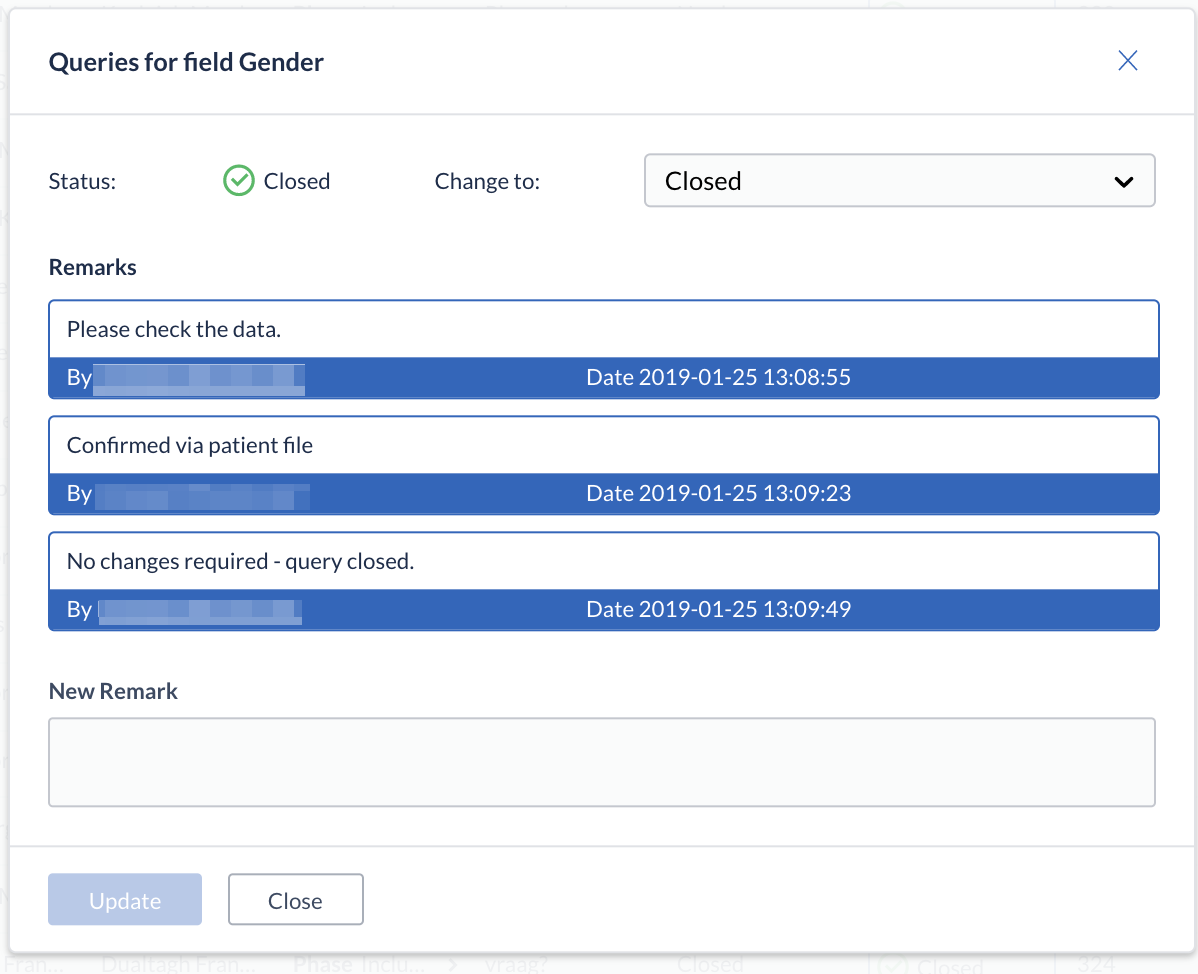
Clicking the status icon next to a query opens an information window, in which all comments related to the query can be reviewed. It is also possible to add a remark and change the status of the query, if necessary.
Validations
The 'Validations' sub-tab displays all active validation fields in study, repeating data or surveys of the type Exclusion, Warning, and Message.
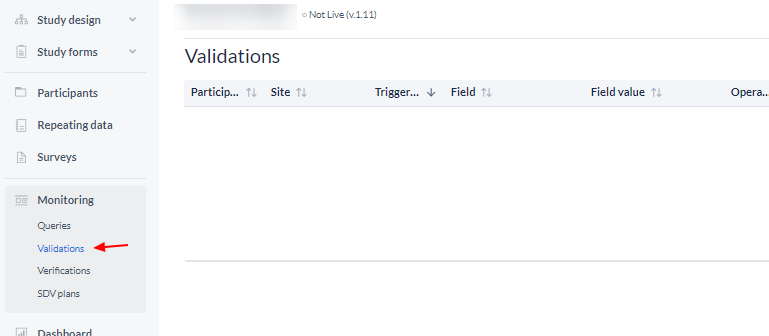
Note: Error validations are not displayed, as any value that triggers an error message is never saved:
- Again you can filter validations by type (Warning, Message, etc.), by site to show participants with validations which belong to a particular site, or by data entry type to show validations for particular form types (study, repeating data or survey).
- An overview of all participants is given with the details of the validation.
- The operator represents how the field value and the reference value are compared, depending on the setup of the validation message. There are several operators: greater than, greater than or equal to, equal to, smaller than, smaller than or equal to, not. The 'Reference value' represents the value that is used in comparison to the value that was entered in a field, as defined during the validation setup.
To open the participant and jump to the form with the validation, click on the eye icon in the column 'View'.
Verifications
In the ‘Verifications’ sub-tab dropping Visit, form, and field-level SDV events are displayed in both participant-level and global for all participants 'Monitoring' tab..
This global sub-tab displays all verifications in the study or in repeating data:
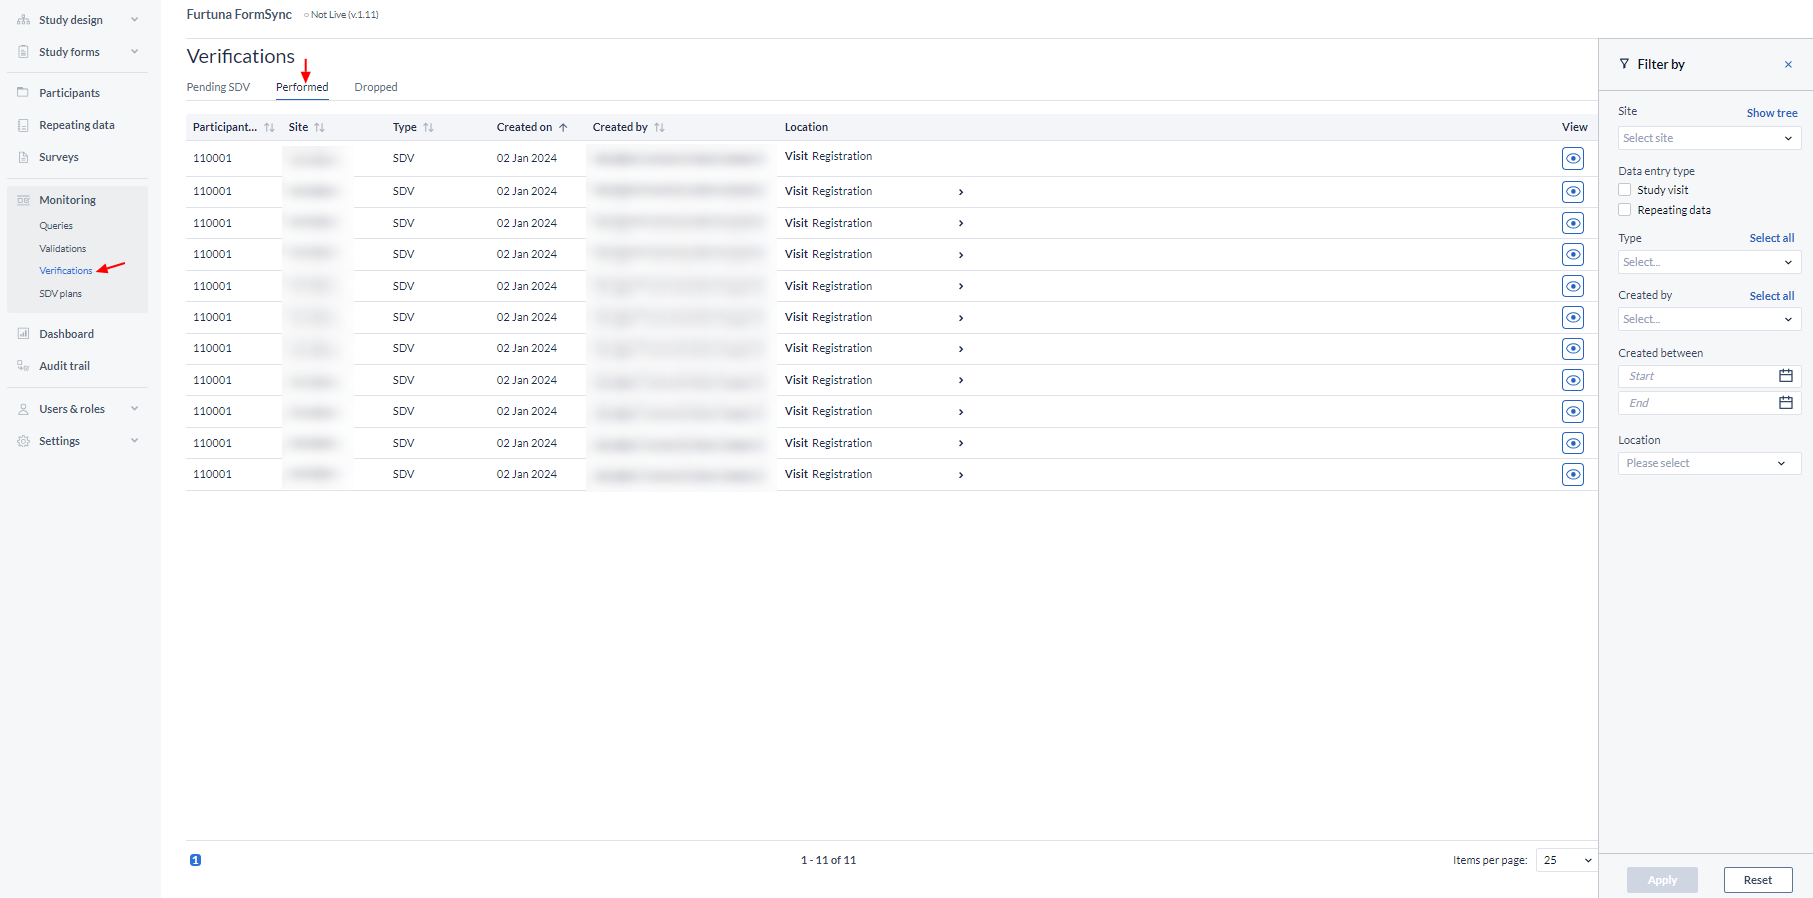
Choose to show dropped, pending or performed verifications only for study or repeating data.
The resulting data can also be filtered by user, by site, and by the data entry type (study or repeating data).
To open the participant and directly view the form where the verification was dropped, click on the eye icon in the column 'View'.

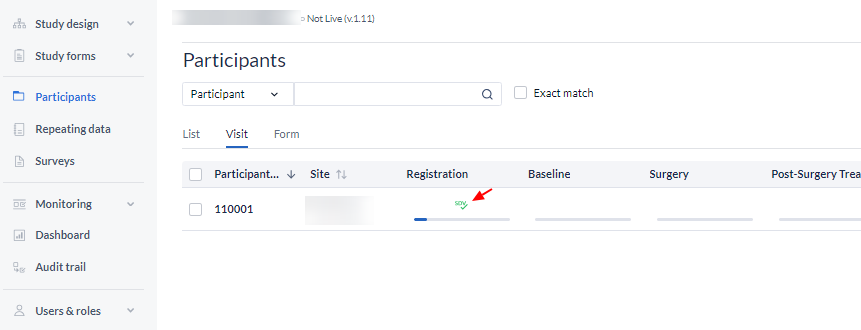
To see all active verifications, go to the 'participants' tab and use the 'Visit' or 'Form' view mode. Forms where source data verification has been applied can be identified by an SDV checkmark.
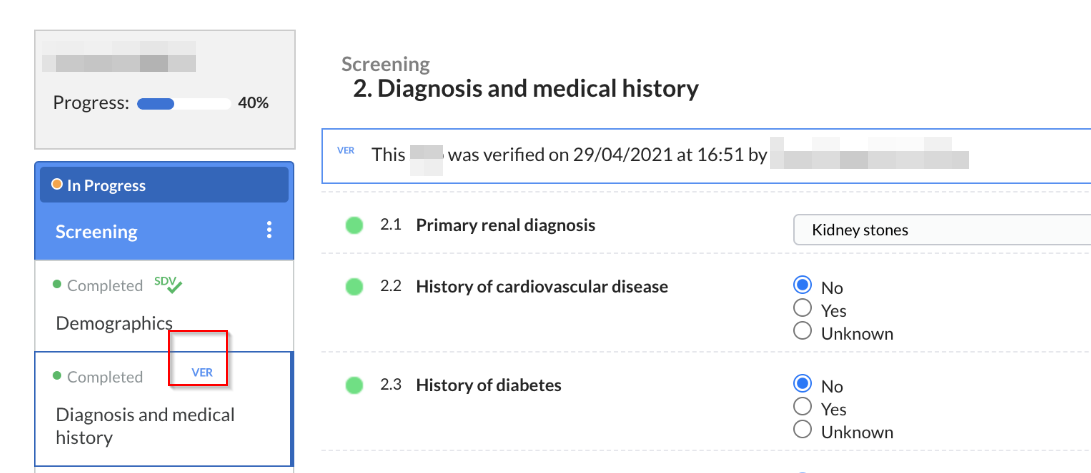
Custom verifications are only displayed in the Visit or Form in the participant directly as a 'VER' icon:
The 'Monitoring' tab will also appear in the participant view and will include the same sub-tabs, but these will contain only the information (queries, validations, and verifications) associated with the selected participant.